- Replacing a newly qualified employee will cost an average of 35% of his/her annual salary.
- For a more experienced employee, this will cost around 150% of salary.
- But to replace an ultra-qualified employee, it can cost up to 300% or even 400% of his or her gross annual salary. “
An in-depth analysis of turnover is therefore essential to optimize payroll costs. In this series of three articles, we will undertake a detailed analysis consisting of three distinct parts:
- Part 1: A presentation of turnover and the data needed to analyze it
- Part 2: How to prepare your turnover analysis by selecting the data that have the greatest impact ?
- Part 3: Turnover: How to optimize payroll costs with PowerBI visualization ?
What is turnover? What are we talking about?
Staff turnover measures the frequency with which employees leave a company AND require replacement. This concept is very important, as it intrinsically implies the need for recruitment.
In the cost of replacing an employee, we can therefore take into account: the cost of the employee’s departure (severance pay), the HR cost (posting an offer, interviewing and selecting a candidate), the cost of onboarding, the cost of training, but also the less tangible cost of the departing employee’s team productivity.
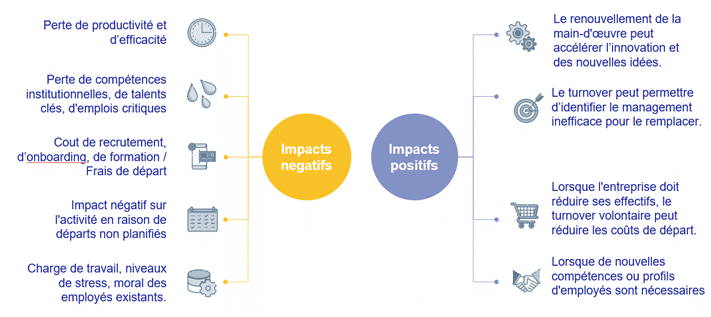
A lower turnover rate means fewer recruitments and, consequently, lower costs for the company. But turnover is not all bad, and can even be very positive, as the diagram below shows:

Data to be taken into account for turnover analysis
Now it’s important to understand how it’s distributed throughout the company. In our study, we will seek to answer 3 key questions:
- Identifying at-risk profiles: Which employees tend to leave the company? What factors affect their departure?
- Analysis of critical periods: When and how often do employees leave?
- Understanding motivations: Why do employees leave?
Let’s start by extracting the dataset we’ll use for our turnover analysis. In our study, we have a 5-year history of data (from January 2018 to June 2022). Our dataset is composed of the following data:
- Employee demographic information: gender, age, seniority ;
- Professional details: professional family, professional subfamily, type of contract, professional category, status ;
- Professional location: division, country, continent ;
- On his performance: notes, works as a manager ;
- Manager profile: gender, age, seniority, country, grade, manager in same country as employee (yes or no) ;
- Employee’s internal history: number of promotions, number of intra-entity internal moves, number of inter-entity internal moves, number of manager changes, whether the employee has been on long-term leave in the last 3 years.
In the field of human resources, theuse of data is crucial for optimal personnel management. It is therefore essential to take the time to select this data carefully, as the reliability of the information gathered will determine the relevance of your HR analysis. The final data must provide an accurate picture of each employee’s situation, i.e. :
- [1] For employees still with the company, their situation at the end of the month.
- [2] For those who left the company during the month, their status on the date of departure.
In addition to the employee characteristics mentioned above, we have the following variables:
- “Calendar_date”: indicates the date on which the employee is still present in the company (case [1]), or the date of departure (case [2]) “State”: creates an additional variable
- “State” with the value “Headcount” in case [1], and “Departures” in case [2].
- “turnover_type”: using the reasons for departures, we create a “turnover_type” variable which indicates the type of turnover involved: “voluntary”, “involuntary”, “other”. In this case, what particularly interests us in this study is voluntary turnover, which often reveals the company’s internal climate.
Having the status of the company’s workforce at the end of each month will enable us to see the evolution of turnover by month in the rest of the study.
This information enables HR managers to better understand staff movements and take informed action, whether to anticipate recruitment needs, manage careers or devise talent retention strategies..
Conclusion on the data needed to analyze turnover
To conclude this first part, we have prepared the ground for our analysis by building up a complete and structured data set, faithfully reflecting the situation of each employee within the company.
This solid base is crucial, as it will enable us to draw an accurate picture ofturnover trends over time.
SQORUS is your partner of choice in this process, providing expertise, innovation and personalized support. Contact us today to discuss your specific requirements.
Let’s turn now to the second part of our study, where we’ll apply exploratory analysis techniques to deconstruct turnover and understand its impacting variables.
We seek to identify recurring patterns and anomalies, in order to distinguish voluntary departures from other forms of turnover. This understanding will pave the way towardsoptimizing payroll costs, enabling us to develop targeted strategies for retaining talent and reducing the costs associated with high turnover..
HR Data strategy: what if we accelerated?
Imagine a world where the HR function is propelled into a new dimension thanks to the power of data. What if this world were within our reach? Discover how to harness the full potential of HR Data to revolutionize your organization.
Contact
A project? A request?A question?
Contact us today and find out how we can work together to make your company’s digital future a reality.


