Would you like to understand why you should conduct a turnover analysis in your organization and what data is important for this? The first part of our study on the data to be taken into account when analyzing turnover has revealed the different facets of this phenomenon, and gives you the employee characteristics and variables to be taken into account.
Let’s dive into the second part of our analysis. In this section, we’ll prepare our data for analysis. We’re going to look at each variable and understand its influence on the employee’s voluntary departure.
Keep in mind that the variable names represent our use case, but that you need to adapt them to your case.
Data preparation and exploratory turnover analysis
To better understand the factors influencing turnover within your organization, it’s essential to look atHR data analysis.
Thanks to the use of data analysis tools such as Python (which we will also use in the rest of the study), we can import these data and prepare our study.
What is exploratory data analysis?
Exploratory Data Analysis (EDA) is used to analyze and study data sets and then summarize their main characteristics, using visualization methods or statistical tests.
It enables you to better understand the variables in a dataset and the relationships between them, and thus determine the best way to manipulate data sources to get the answers you need.
1st stage of EDA: analysis of missing values
The first thing to do is to look at the missing values. These gaps can be revealing and need to be treated with care. We notice that more than 50% of the employee and manager score data are missing, so we decide to exclude these variables. For the other variables, missing values represent less than 4% of the dataset, so we simply delete the rows associated with them. This way of thinking is just one example, but it’s important to analyze the impact this kind of decision can have on the final results.
What is chi2 and why use it to analyze turnover data?
Now we want to know whether all the variables selected at the outset are relevant to our analysis. We will therefore apply a chi2 statistical test of independence to each of our variables individually.
We choose to use the chi2 test because it’s a test of independence for categorical variables that shows whether one variable depends on another. Here, we want to know whether a variable has an influence on departures, i.e. whether departures are dependent on any variable. For example, in our case, if we apply the test to the age variable, we have seen that age has an influence on departures.
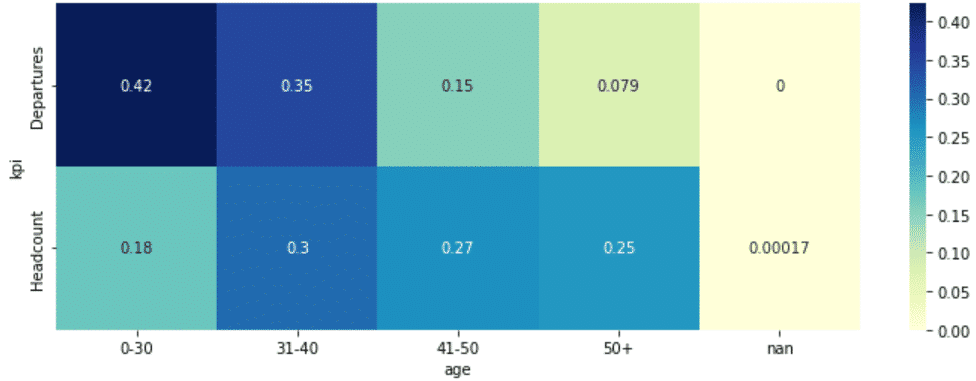
We can therefore model a contingency table:

This contingency table shows that the youngest employees
(aged 0-30 and 31-40) account for a high proportion of departures: 42% + 35% of departures are in these age brackets. This is not the final result, but a complement to the results that may or may not be visible on the dashboard.
The chi2 test therefore enabled us to determine which variables to exclude from our study. In our case, we have deduced that the number of internal transfers and long-term leave have no impact on departures, so we will not take them into account in our study. Apart from these, we will use all other variables.
Conclusion on data preparation and exploratory turnover analysis
To conclude this second part,exploratory data analysis has proved to be a valuable tool for deciphering the complexities inherent in our data set.
In this way, we have been able to identify the variables that merit particular attention in the next stages of the study.
The chi2 test, applied systematically to all variables over an extended period, provides a rich and relevant dataset for thestudy of turnover.
SQORUS is your partner of choice in this process, providing expertise, innovation and personalized support. Contact us today to discuss your specific requirements.
In our third and final part, we show you how touse PowerBI to easily visualize turnover data and find solutions.
This tool will enable you to immediately grasp trends,identify significantturnover factors and make informed decisions to optimize payroll management.
What tools can you use to manage your HR strategy?
Optimize your HR strategy and discover the essential management tools you need to achieve your objectives. Don't miss this opportunity to successfully manage your HR projects.
See also our feature on "HR strategy management tools".
- What are the key issues facing HR departments today?
- Organization, talent management, recruitment: priority HR projects?
- Human resources management: what HR strategies for the future?
- Best practices to manage your HR strategy in an optimal way
- The different HR management tools to carry out your HR strategy
- HRIS software: the different areas of intervention for the HR function
- How to convince your management to invest in an HRIS tool?
- Is it necessary to be accompanied in the management of an HR strategy?
- What indicators should be defined to measure the performance of an HR strategy?
- HR strategy: how to achieve effective HR reporting?
- Who should drive HR projects in the company?
- Setting up a working group for an HR project: who should be involved?
Contact
A project? A request?A question?
Contact us today and find out how we can work together to make your company’s digital future a reality.


