The year 2023 was marked by a series of significant updates to the Oracle Analytics Cloud (OAC), taking its functionality to new heights of performance, accessibility and security.
These advances have been designed to meet the growing needs of businesses for data analysis and strategic decision-making.
In this article, we’ll explore some of the major updates that have redefined the analytics landscape within the OAC ecosystem in 2023.
Oracle Analytics Cloud is the platform of choice, offering a complete, integrated solution for data mining, visualization and advanced reporting. This powerful cloud solution enables organizations of all sizes to benefit from agile, scalable and feature-rich business intelligence.
Designed to adapt to the most demanding environments, OAC stands out for its ability to transform massive volumes of raw data into actionable insights, thanks to an intuitive interface and sophisticated analysis tools.
Whether for ad hoc analysis, interactive dashboards or machine learning-based forecasting, Oracle Analytics Cloud is positioned as a strategic decision engine.
In this article, we highlight its new features. These innovations are designed to further refine your data analysis strategy and keep you competitive . .
#1 Update settings in Oracle Analytics Cloud
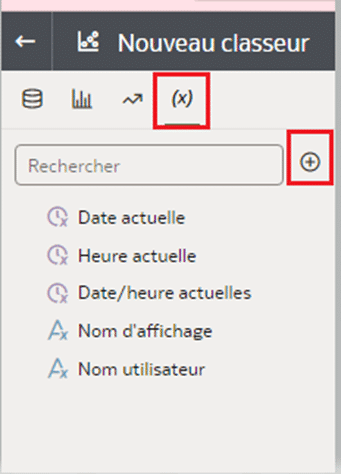
This is the major feature of Oracle Analytics Cloud in 2023. Functioning like the presentation variables of the classic version, parameters store defined values that can be reused at several levels throughout the workbook, notably at filter level, where they can be used to store values selected in a filter and apply them dynamically to an entire workbook.
To create a parameter in a workbook, select “Parameters” in the data palette and click on “Add”.
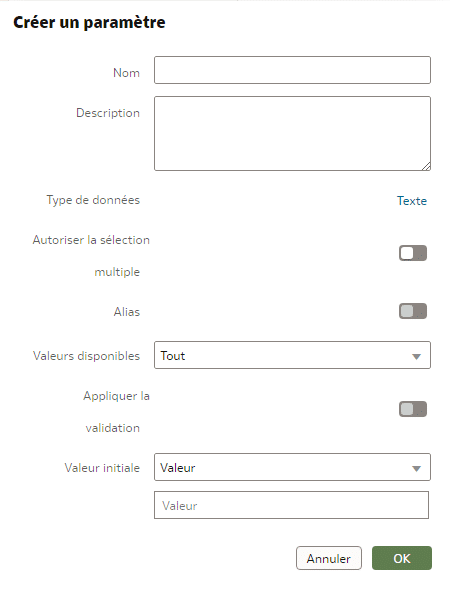
In the “Create parameter” dialog box, enter a unique name and optional description, select the data type, specify the list of possible values, select one or more initial values, then click “OK”.
Various options are available to define the list of possible values for the parameter and its default value:
- Value: the parameter will take one of the values listed manually by the user
- Column: the parameter is filled with all possible values of a field present in the dataset
- Logical SQL query: the parameter is fed by the result of a query executed on the dataset.
#2 OAC’s semantic model creation interface
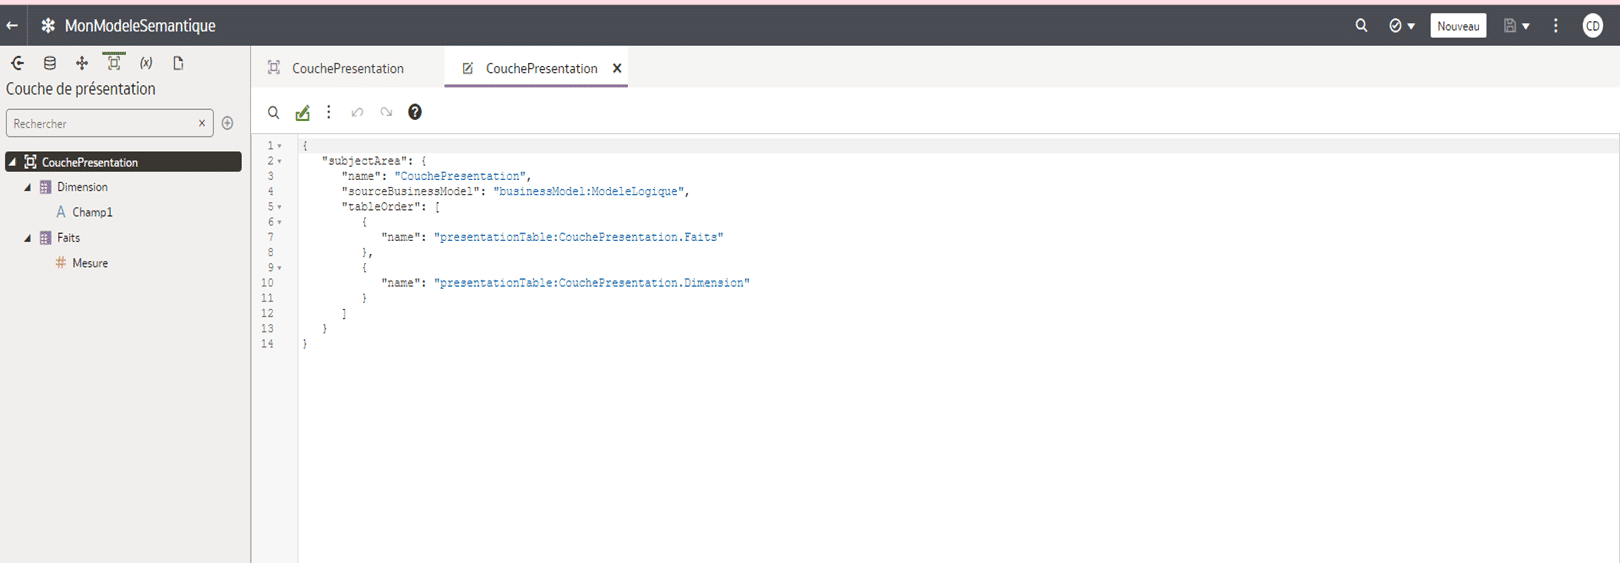
Already available since 2022, the semantic model creation interface has been enhanced to provide a more intuitive tool for modeling and structuring information, facilitating the analysis and interpretation of complex data. These include the addition of features such as the lineage view and the display of linked objects, which enable all data modeling steps to be traced across all layers, and also the SMML editor, which enables developers to create/modify models via a simple, intuitive language.
#3 Managing user access rights
OAC DV took an all-or-nothing approach to access rights (a user with the DVContentAuthor role, for example, could create any type of object (i.e. workbooks, datasets, data streams, connections, sequences and learning models).
This has always been one of the main obstacles to the adoption of data visualization.
It is now possible to manipulate access rights to objects, giving users greater control over their actions on Oracle Analytics Cloud DV. To do this, simply create a custom application role to which you can assign different rights on all objects.
Use case: Authorize workbook creation/modification only
Click on “Users and roles” in the “Console” page, select the “Application role” tab and click on the “Create application role” button to create a new user-defined application role..
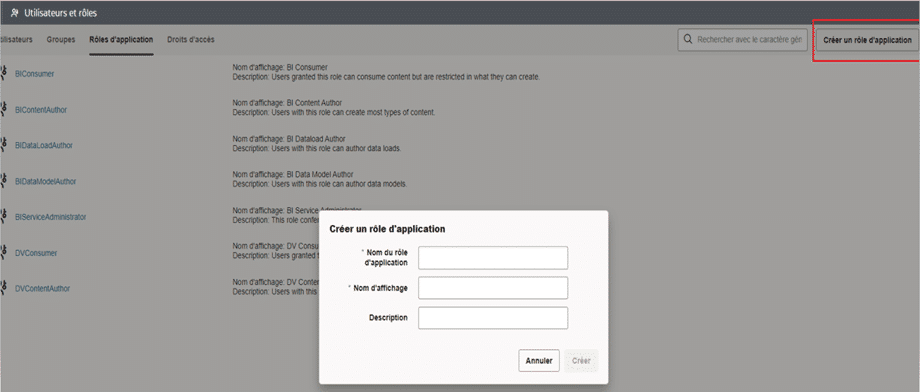
Click on the name of the created application role, click on “Authorizations” on the left-hand side of the page, then click on the “Add access rights” button..

In the “Add access rights” dialog box, select “Create and Edit Workbooks” from the list, then click on the “Add” button.
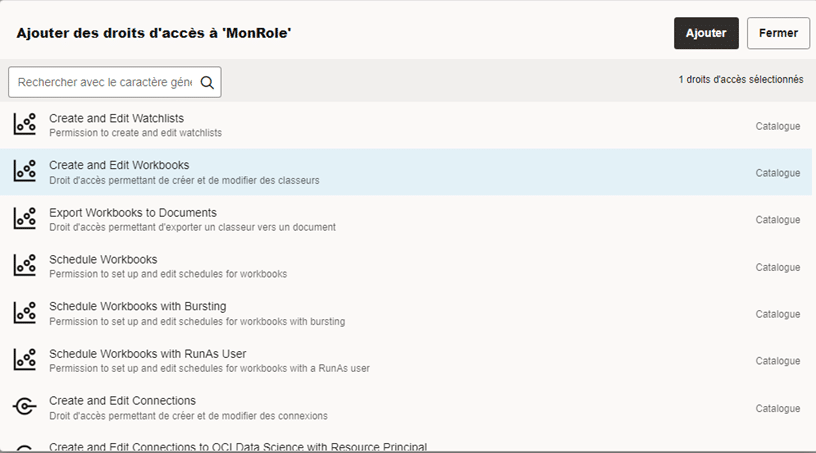
That’s it! You’ll need to assign the new application role to the various users concerned. Please note that it is not possible to modify the platform’s default application roles.
#4 Checklists
Checklists have been introduced to give users easy access to their tasks and analyses, promoting structured organization and increased productivity. They can be used to group visualizations from one or more workbooks and display them as visualization cards on the home page.
Checklist items are private and cannot be shared with other users.
#5 Sharing data streams & sequences
Developer requests have also been taken into account in 2023, including the possibility of multiple access and editing of data streams and sequences, like most of the objects available on OAC.
Users granted access to streams or sequences are granted read-only access to input datasets and full access (read/write) to output datasets..
#6 Adding AutoML to OAC data streams
AutoML is part of theOracle Machine Learning (OML)offering and provides an easy-to-use, automated solution for creating and deploying machine learning models, enabling companies to benefit from the power of machine learning without advanced data science skills.
AutoML in data flows recommends and drives a predictive model. AutoML analyzes the data, calculates the best algorithm to use and saves a prediction model in the Models area of the Machine Learning page in OAC.
Simply create a data stream, add the dataset containing the data to be analyzed and configure the AutoML step. You’ll need to specify the target column to be predicted, the type of task (regression or classification) and the model ranking metric to be optimized.
#7 Conditional formatting
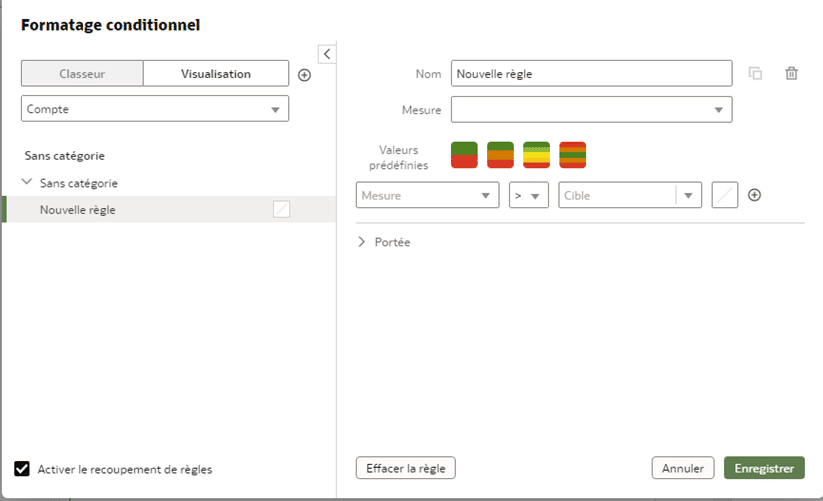
Conditional formatting has been enriched to offer extensive visualization customization, enabling users to highlight important or interesting features, thus facilitating data interpretation. 2 main features have been added to the conditional formatting options:
Merging conditional formatting rules
You can merge several rules for the same measurement and apply them all at once to a view or workbook. All you have to do is check the Enable rule overlap box in the dialog box.
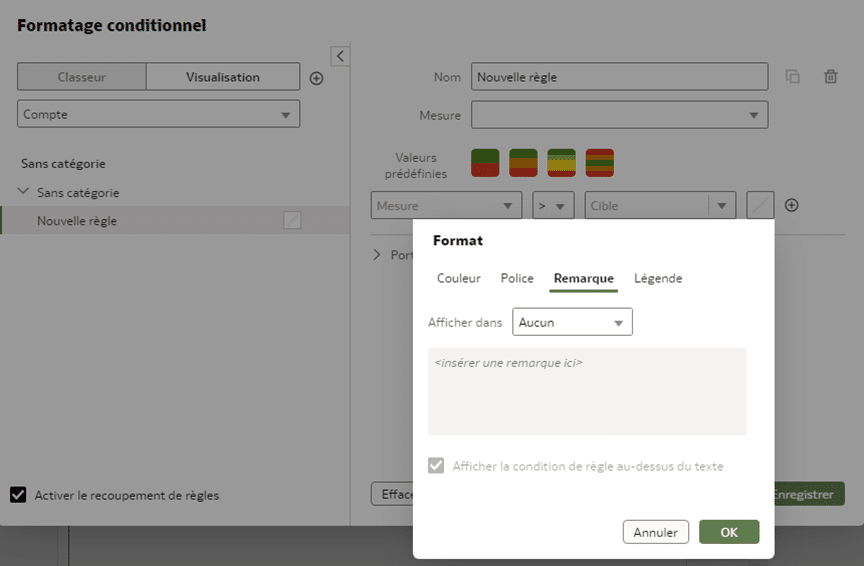
Annotations
The data annotation is added to the list of conditional formatting options. Combining annotation with conditional formatting helps to highlight critical information requiring special attention.
#8 Some visualization enhancements in Oracle Analytics Cloud
Finally, a number of visualization enhancements have been made to provide a richer, more informative visual experience, enabling users to create dynamic and powerful presentations of their data..
The mosaic
Mosaic visualization has been replaced and enhanced, notably with the possibility of including several measurements (one main measurement and several secondary measurements) to simply specify information.
It is also possible to add a mini graph to enhance the visualization, showing, for example, the evolution of the displayed measurement over time.
The cards
Administrators can now assign a default map background to map layers, making it easier for developers to create map visualizations.
The size of map bubbles can also be modified. A minimum and maximum pixel size can be applied to the bubbles, allowing you to control the size of the map as a function of zoom level and the density of positions rendered on the map.
Oracle Analytics Cloud new features concluded
These major upgrades reflect Oracle’s ongoing commitment to providing leading data analytics solutions , positioning Oracle Analytics Cloud as a must-have platform for companies looking to unlock the full potential of their data.
It’s important to stress that the effectiveness of these analyses can be increased tenfold by seamless integration of systems and applications.
This is where Oracle Integration Cloud Gen3 and its new featureswhich offer advanced solutions for seamless integration and automated workflow.
In short, to remain competitive and To take full advantage of Oracle Analytics Cloud, it’s crucial to adopt a strategic approach to the integration of updates. SQORUS is your partner of choice in this process, providing expertise, innovation and personalized support. Contact us today to discuss your specific requirements and get started. optimize your eco-system.
All about IT project governance
Discover the roles and responsibilities of key profiles, as well as best practices in governance and technological development, to ensure the success of your digital transformation projects.
Also read in our "IT project governance" file:
- Lowcode platform: the future of application development?
- The use of UIPATH as an RPA solution
- Project comitology: the governance bodies of an IT project and their roles
- Steering and governance of a Finance IS project: which profiles should be involved?
- Steering and governance of an IT project: which profiles should be involved?
- Project governance: what role for the steering committee?
- The actors of a project team: organization, role and skills
- The IS manager at the heart of the development and evolution of systems
- HRIS Manager: what role in the evolution of HR Information Systems?
- IS project manager: what role and responsibility in an IS project?
- Functional consultant: a role close to the business processes
- Technical consultant: a profession at the heart of technological development
- Solution architect: a profession that manages development and deployment
- DevOps Consultant: role, missions and development skills
- Data Protection Officer (DPO): what roles and missions?
- CISO: a key job within the business for system security
- The service delivery manager at the heart of team management
- Scrum master, a key profession for Scrum project management
- Data scientist: a strategic profession at the service of management
- MOA / MOE: how are the roles divided on a project of implementation of an information system?
Contact
A project? A request?A question?
Contact us today and find out how we can work together to make your company’s digital future a reality.


