L’artificial intelligence (AI) has established itself as a force to be reckoned with in many sectors, bringing a clear return on investment. However, its application in strategic areas, such as real estate decision-making, is less obvious. Find out in this article how theAI can play a crucial role in the real estate sector by focusing on a specific use case: projecting the projecting the CSR trajectory of a real estate portfolio.
In the operational field,artificial intelligence has made a name for itself in many areas, thanks to its obvious return on investment. Let’s take the example of document classification: let’s consider a supervised trained classification model that we compare to a collaborator. The return on investment over 5 years will be the cost per employee to carry out all these actions over 5 years, minus the time it takes to set up the end-to-end model (data, development and industrialization) and to maintain it.
When we look at the functional domain, more specifically at supporting strategic decision-making, the profitability of implementing artificial intelligence is less natural.
So, in this article, I propose a strategic use case to give you an idea of what can be achieved in the functional field. The latter focuses on a property portfolio, with the aim of projecting its CSR trajectory (for decision-making purposes).
The resulting objectives are :
- Predict energy consumption and greenhouse gas emissions
- Making prediction results available and accessible
The project was carried out in 6 distinct phases.
1. Data selection, definition and extraction
The American state of Washington has made this data available as open source data for its real estate portfolio (buildings owned by the state). The dataset covers two years: 2015 and 2016. It comprises 56 variables and almost 4,000 separate buildings. Thus, a line is uniquely identified by a building over a year…
This first step required a thorough understanding of the variables, creating a solid foundation for the rest of the project.
2. Expression of hypotheses
Our approach focused on a supervised regression model to predict energy consumption and greenhouse gas emissions. These 2 explanatory variables are part of our dataset, so we’re in the case of a supervised regression model, with a 2-dimensional output.
Here, we’ll assume that we’re at the start of 2016, so we have the explanatory variables for 2015 and 2016, but the variables to be explained are from 2015.
By considering these two explanatory variables, our model aimed toanticipate developments over the coming years.
3. Exploratory analysis
The actual data, while rich in information, required in-depth statistical analysis and careful cleaning to eliminate redundancies and variables of little interest to our study.
After a statistical study and a complete clean-up (the interdependence of certain variables or presenting little information), we obtain the following final dataset: 22 relevant variables for around 3,000 buildings.
4. Modeling
For this section, only 2015 data are considered, as we need to have the variables to explain.
We have separated this dataset into 2 bases: a training base and a test base. This separation is stratified, with 80% of the lines in the training base and the remaining 20% in the test base.
A set of regression models was then defined, providing a complete approach, from the most naive (linear) to the most complex. Added to this is the implementation of a grid search coupled with 5-layer cross-validation based on 10 data separations (identical for all models). This enables all hyperparameter combinations to be tested, while limiting the uncertainty linked to the separation of data between test and training bases.
5. Evaluation
Numerous indicators can be used toassess the performance of these models, but the 2 indicators that have been chosen are :
- The aim here is to maximize the R². Indeed, if we were simply to define this indicator, it would be the proportion of results explained by the model.
- The aim is to minimize the mean square error. A simple definition of this indicator is to measure the difference between what is predicted and what is expected.
Thus, the model with the best average balance (based on 10 iterations of 5-layer cross-validation) between maximizing R² and minimizing mean squared error is the selected model.
6. Application and results
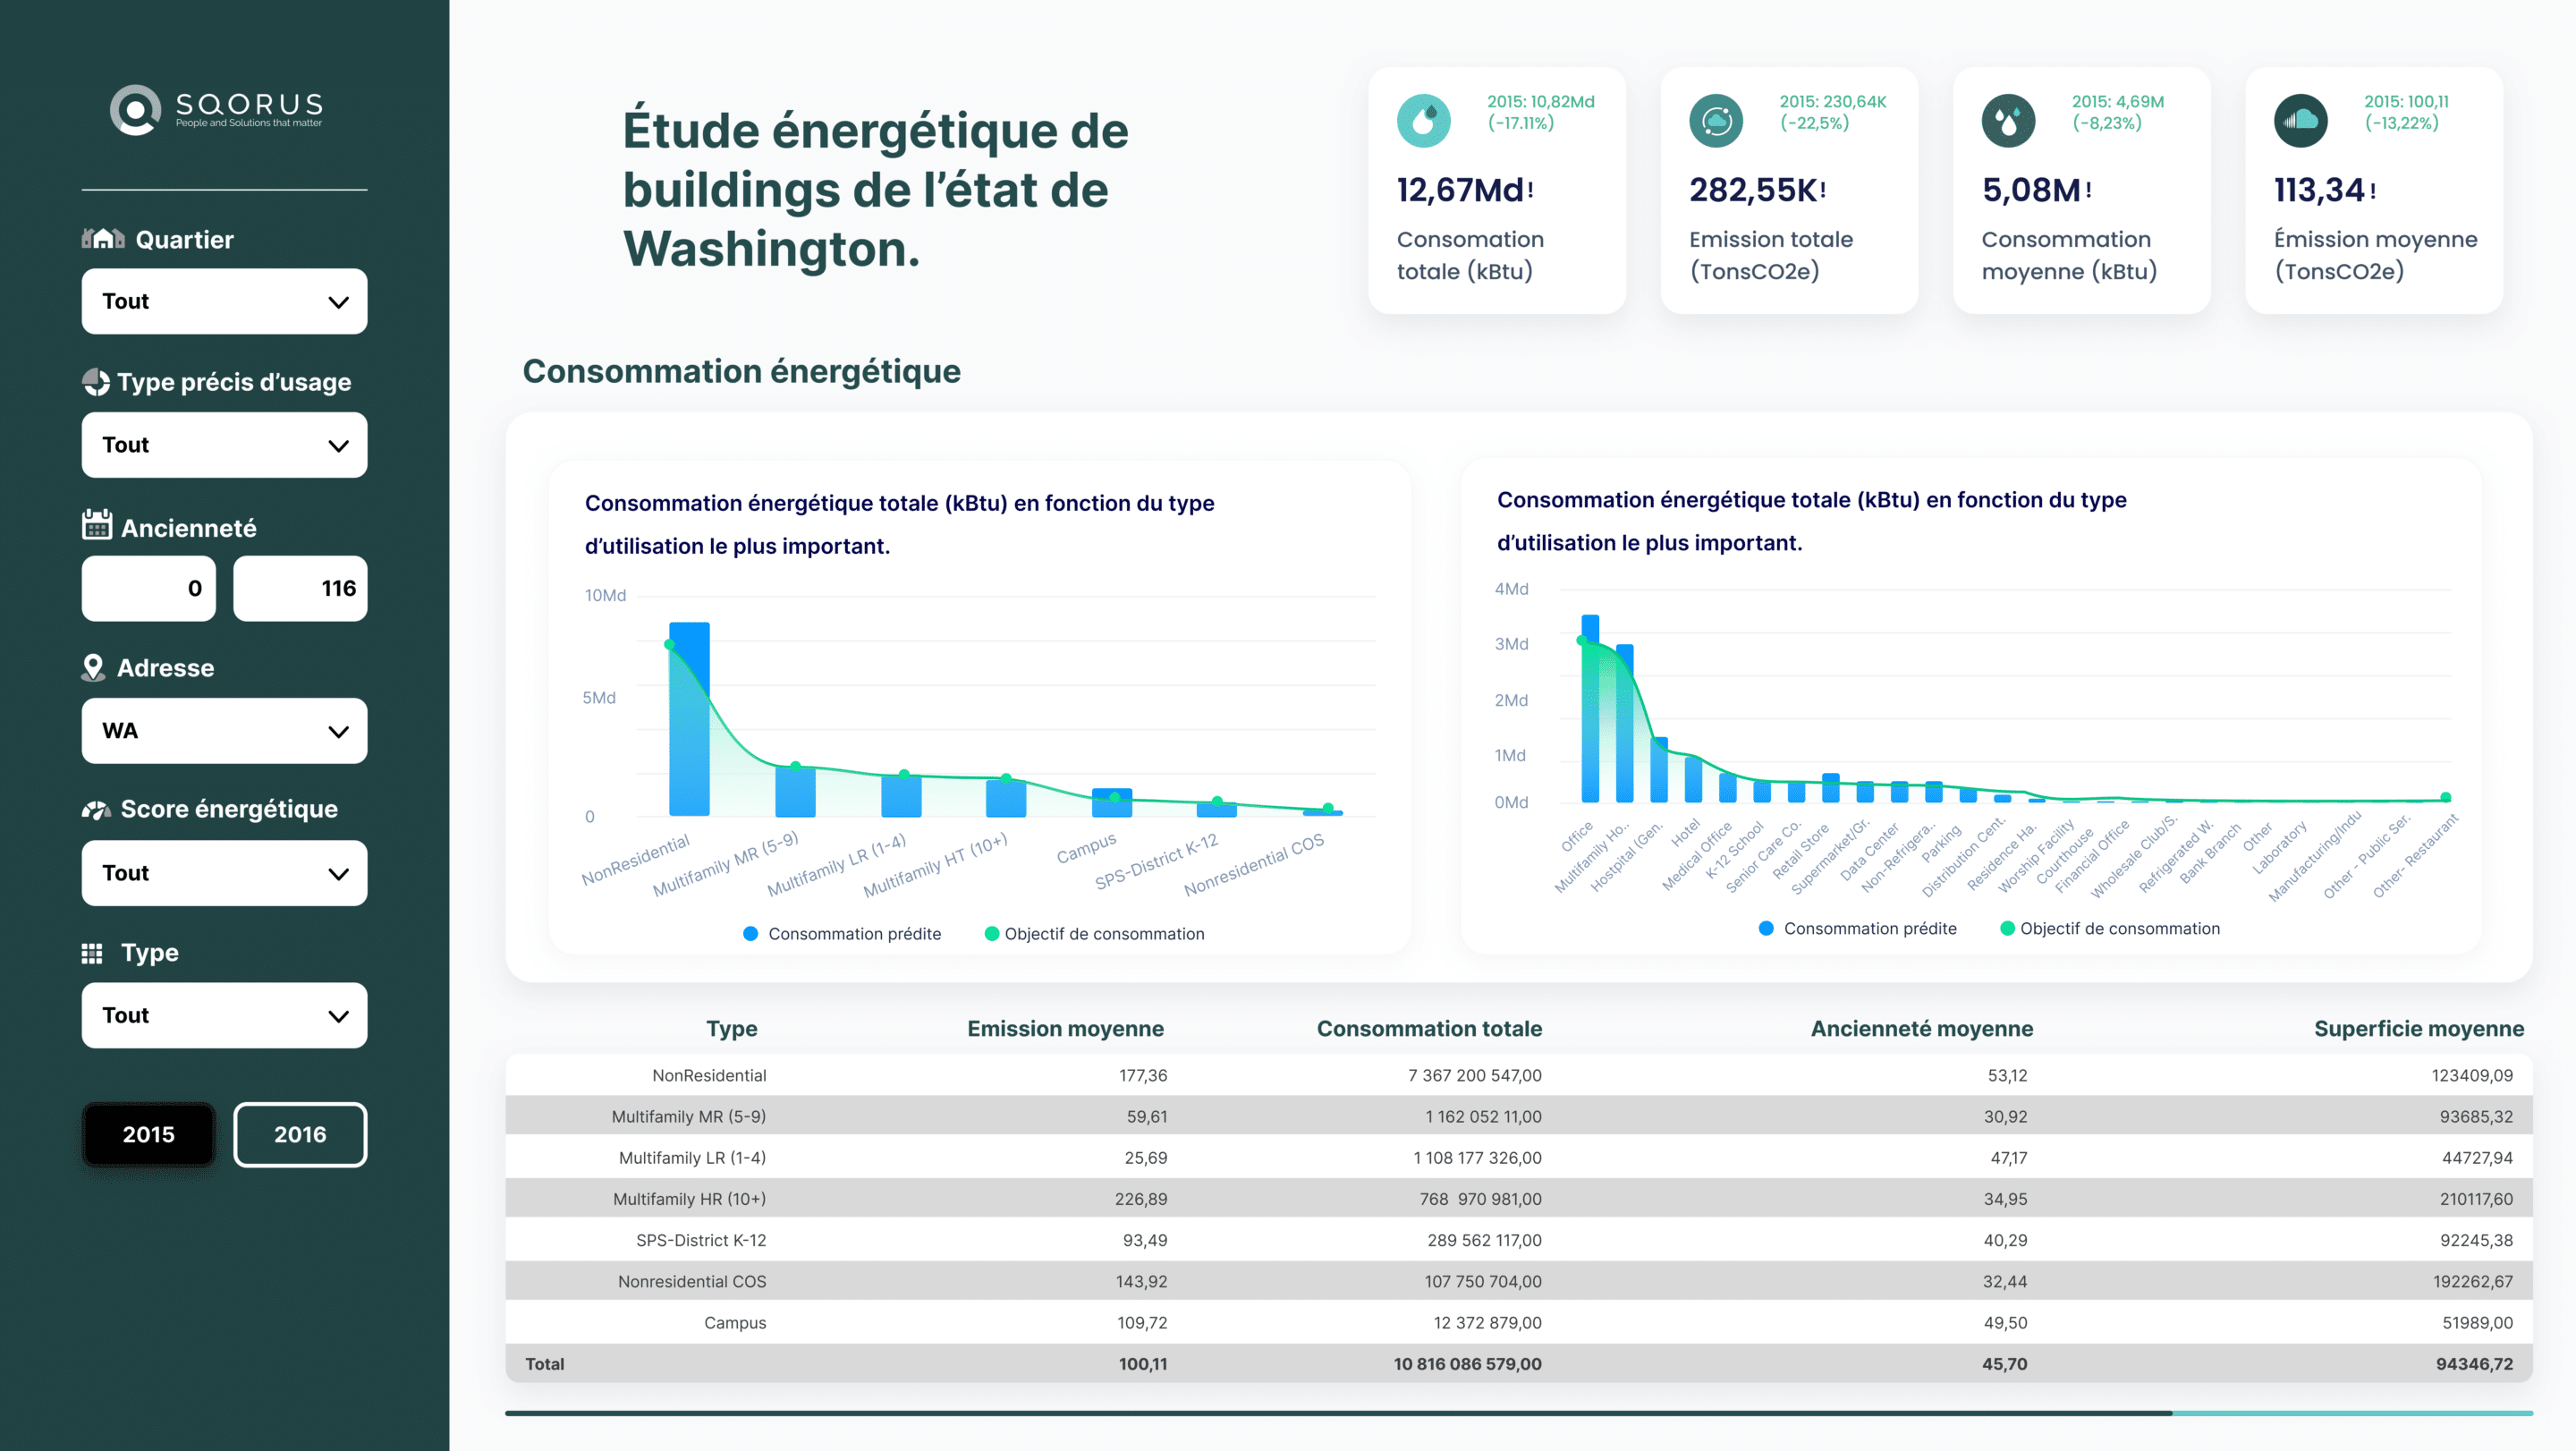
Finally, the model (trained and tested using 2015 data ) was applied to 2016 data. The results are presented in a PowerBI report. This report offers a detailed view by modality and a geographical perspective of the buildings, clearly presenting predictions of energy consumption andgreenhouse gas emissions.
It is composed of 2 tabs sensitive to different filters. The first tab is devoted to a detailed view by modality according to the variables selected. The second tab shows the geographical location of the various buildings.
On each of these tabs, we find within the header, 4 key indicators predicted for the year 2016: Total energy consumption,total greenhouse gas emissions, average energy consumption andaverage greenhouse gas emissions. Below each of these indicators is the percentage increase or decrease compared with 2015.
As we can see in Appendix 1, the negative percentages of the 4 indicators in the heading for all buildings (comparing the figures predicted for 2016 with those for 2015) indicate that we will fall short of our target (consumption and emissions lower than the previous year). It is therefore possible toadjust the data for the explanatory variables in order toobtain a differentemissions and consumption trajectory and achieve these future targets.

Conclusion of our strategic CSR projection for a property portfolio
This POC (proof of concept), beyond a simple demonstration of feasibility, paves the way for a new approach to strategic decision-making in the real estate sector.
The encouraging results point to the possibility of adjusting explanatory variables to meet future environmental targets.
However, we recognize that the presentation of results, while technical, must be accessible to a diverse audience. We’re committed to making this powerful technology simpler and more straightforward, demonstrating that data science can be understood and applied by everyone, regardless of their level of familiarity with the field.
If you’d also like to leverage the benefits ofartificial intelligence for CSR projections or any other topic, we can help you do just that.
Contact us today to discuss how SQORUS can guide you in integrating these innovative solutions into your strategy.
All about IT project governance
Discover the roles and responsibilities of key profiles, as well as best practices in governance and technological development, to ensure the success of your digital transformation projects.
Also read in our "IT project governance" file:
- Lowcode platform: the future of application development?
- The use of UIPATH as an RPA solution
- Project comitology: the governance bodies of an IT project and their roles
- Steering and governance of a Finance IS project: which profiles should be involved?
- Steering and governance of an IT project: which profiles should be involved?
- Project governance: what role for the steering committee?
- The actors of a project team: organization, role and skills
- The IS manager at the heart of the development and evolution of systems
- HRIS Manager: what role in the evolution of HR Information Systems?
- IS project manager: what role and responsibility in an IS project?
- Functional consultant: a role close to the business processes
- Technical consultant: a profession at the heart of technological development
- Solution architect: a profession that manages development and deployment
- DevOps Consultant: role, missions and development skills
- Data Protection Officer (DPO): what roles and missions?
- CISO: a key job within the business for system security
- The service delivery manager at the heart of team management
- Scrum master, a key profession for Scrum project management
- Data scientist: a strategic profession at the service of management
- MOA / MOE: how are the roles divided on a project of implementation of an information system?
Contact
A project? A request?A question?
Contact us today and find out how we can work together to make your company’s digital future a reality.


